


Drop-off Assay for Determining Mutant DNA Population
Digital PCR (dPCR) can now be used for a wide range of applications and offers superior precision to traditionally used qPCR. Several digital PCR applications robustly and reliably detect sequence mutations and are particularly advantageous in an oncology context. For example, as described in the Rare Mutation Detection tutorial, dPCR can detect rare mutations in samples with a low concentration of the target DNA.
Importantly, using a drop-off assay, dPCR can maximize the data output of samples in a single assay by simultaneously detecting the presence of multiple sequence insertions, deletions or mutations occurring within a defined genomic interval.
In this tutorial, we will walk you through a drop-off assay, from setting it up to analyzing the data. Here, we use the example of detecting a set of the most prevalent KRAS mutations on Exon 12 (KRAS G12) in colorectal cancer.
Other important applications for a Drop-off assay include detection of BRAF, NRAS, EGFR and other mutations in oncology. Additionally, a Drop-off assay can also be used to detect the mutations induced using CRISPR.
Assay Definition
How does a drop-off assay work?
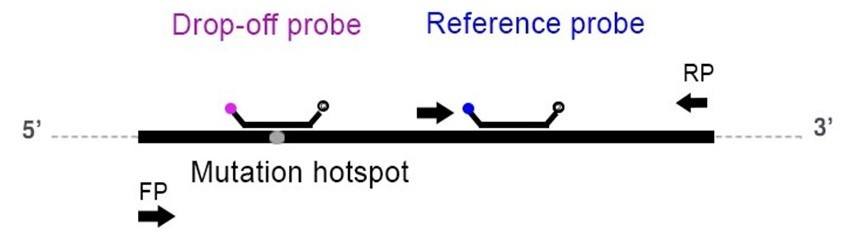
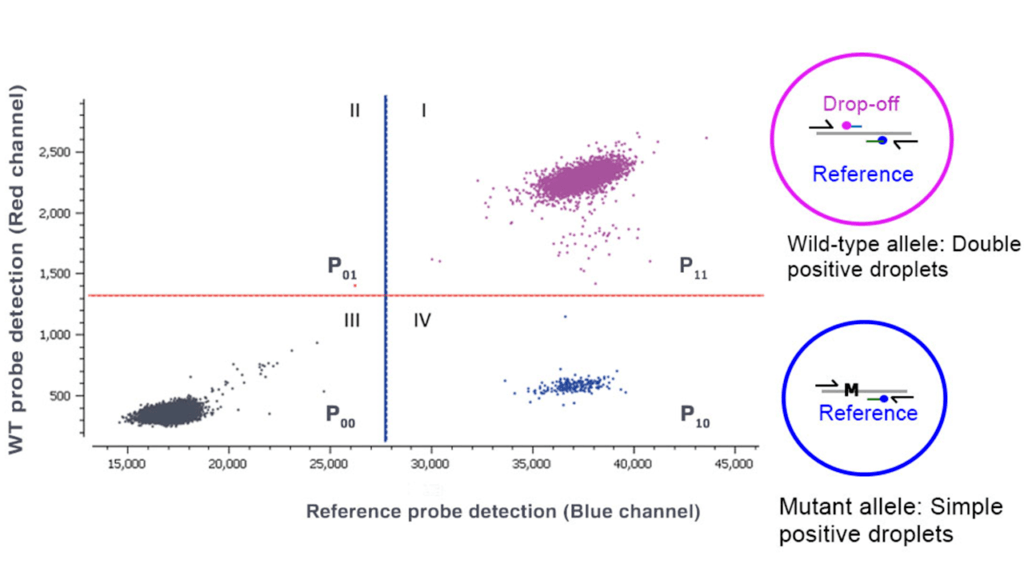
A drop-off assay uses two probes: one wild-type (WT) or drop-off probe and one reference probe. The WT probe spans the mutation hotspot but is uniquely complementary to the wild-type sequence, whereas the reference probe binds specifically to the WT allele in a region adjacent to but nonoverlapping with the mutation site (Figure 1). In the case of a WT allele, both the probes bind to their complementary regions and produce a fluorescent signal, hence producing a double positive population. In the case of a mutation/deletion/insertion, the binding of the WT probe is destabilized and no longer recognizes its target, hence yielding only a single positive population for the reference probe.
Assay Design
How to design a drop-off assay?
Note: The rules for designing primers and probes for dPCR and qPCR follow similar principles.
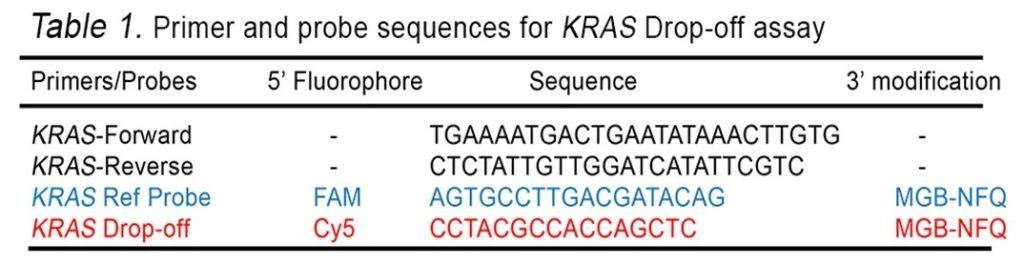
In this example assay, we use one set of primers: the KRAS WT probe labeled with the Cy5 fluorophore, and the KRAS reference probe labeled with the FAM fluorophore.
Materials
What are the materials required for this assay?
The materials required for a dPCR experiment are:
- dPCR equipment with the capacity to simultaneously detect at least two different fluorescence wavelengths
- PCR MasterMix (standard kit) containing the required reagents including:
- DNA polymerase
- Deoxyribonucleotides
- Reaction buffer
- Magnesium chloride
- Nuclease-free water
- Fluorescein (a reference dye; varies from different manufacturers for the specific kits)
Specifically, for this experiment, the following are required:
- WT DNA
- Sample DNA containing the KRAS G12 mutated sequence
- Forward and reverse primers to amplify KRAS DNA (see Table 1)
- A Cy5 labeled hydrolysis probe to detect the WT KRAS sequence (see Table 1)
- A FAM-labeled hydrolysis probe to detect the KRAS reference sequence (see Table 1)
- The restriction enzyme Tru1L
Important note for a drop-off assay in oncology:
- The desired amplicon size in a drop-off dPCR reaction should be <120bp. Indeed, DNA originating from patient liquid biopsy samples (circulating tumor DNA or ctDNA) and formalin-fixed, paraffin-embedded (FFPE) samples are frequently used as a template source for dPCR and are fragmented due to the process of natural cell death or chemical treatment, respectively.
- In the case where high molecular weight DNA or unfragmented DNA samples are used, using a restriction enzyme or sonicating the samples to an average size of about 200bp is highly recommended to fragment the DNA for optimal population separability. However, it is mandatory to verify that the chosen restriction enzyme does not target any of the amplicons. For our experiments, we used Tru1L after confirming efficiency in our samples.
- Adding chemical modifications such as a Minor Grove Binder (MGB) and Locked-Nucleic Acid (LNA) bases to the probes helps to increase their melting temperature (TM) and, as such, their target specificity.
PCR Mix Preparation
Preparation of the PCR mix
Note: This protocol has been optimized using the Naica™ System and the Sapphire Chip. The naica® System has the capacity to detect targets in 3 colors. The ability to detect and analyze the red channel (for example the Cy5 fluorophore) is unique to the 3-color naica® System. In this tutorial, the FAM hydrolysis with the reference sequence was detected in the blue channel, and the Cy5 hydrolysis upon hybridization with the WT sequence was detected in the red channel. An additional channel (green; HEX, Cy3) can be used to detect a target or internal control.
Why is it critical to purify the DNA and quantify it? Follow this link to learn how you can purify and perform DNA preparation for Digital PCR.
It is also important to have a worksheet ready before sitting at the bench to perform an experiment, so you have all the calculations handy.
The calculations for digital PCR are similar to those for qPCR.
For each dPCR experiment, you need to know:
- The number of total samples to be analyzed in order to prepare a sufficient quantity of MasterMix: Always calculate for “n+1” samples, where “n” is the number of samples to be tested. For example, if you have 9 samples, prepare a MasterMix for 10 samples to have excess in case of any volume loss during pipetting.
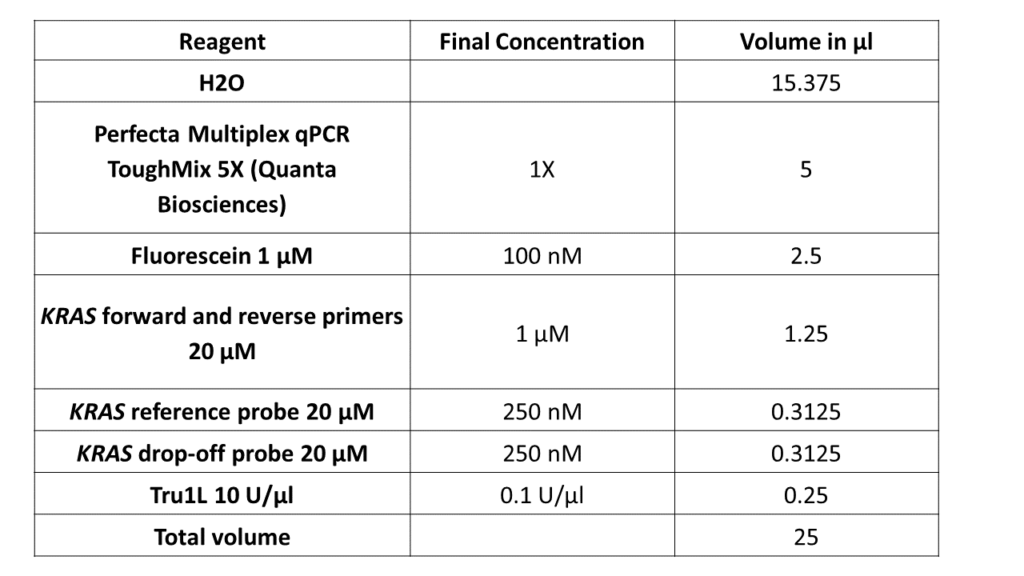
- The instructions for the PCR mix:
Get Results
What are the next steps to get my results?
a. Performing the experiment
Working in a clean, DNase-free space and having no sources of contamination is essential. A PCR hood is recommended. Mix the desired quantity of reagents based on the working sheet in a single tube before loading. The workflow varies for each dPCR equipment. Please follow the User Manual for the equipment you are using. For a brief overview- see this item about Performing Digital PCR Hands-on.
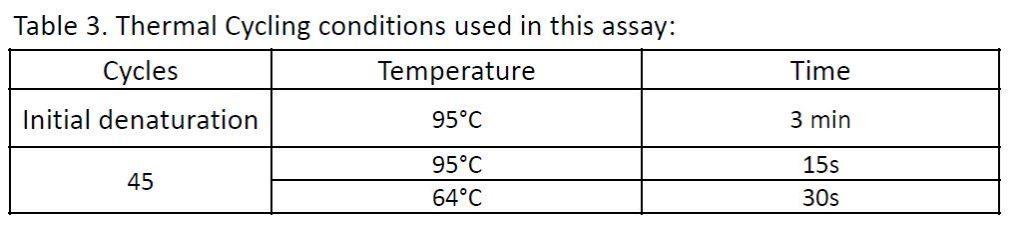
Thermal Cycling conditions used for this experiment:
Determining the Limit of Blank (LOB):
As false positives are assay dependent and may arise from several different sources including polymerase error, DNA contamination, or non-stringent PCR or probe conditions, it is necessary to determine the LOB of the mutant. The LOB is defined according to Armbruster and Pry (2009) as “the highest apparent analyte concentration expected to be found when replicates of a blank sample containing no analyte are tested” for a given confidence level (typically 95%). The mutant LOB can be determined by performing a total of n≥30 replicate experiments containing a background of wild-type DNA and recording the number of observed “false positive events”. In the drop-off case, a false positive event is a partition that is simultaneously positive for the reference channel and negative for the wild-type channel.
For LOB calculation please see the following link: LOB and LOD determination.
Once the LOB is determined, a KRAS mutant is said to be detected if the number of observed positive events for the mutant is strictly greater than the LOB.
Analyze Data
How to analyze the dPCR data?
Note: The sample partitions produced using the Naica™ System are referred to as “droplets” since the partitions are arranged in a droplet crystal which is typical for the Naica™ System.
a. Quality controls
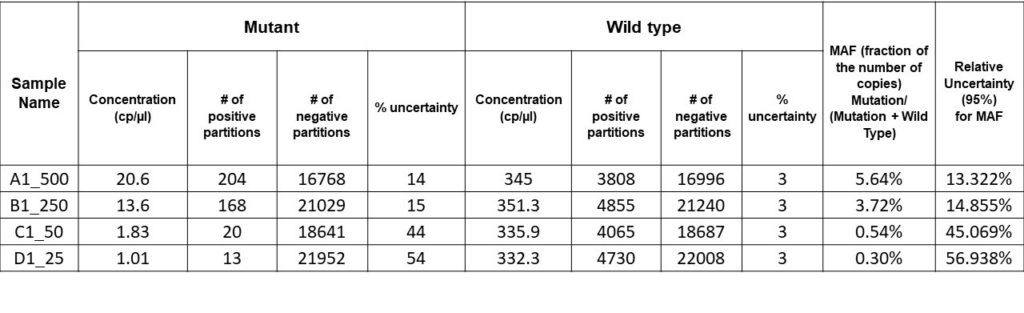
- The total number of partitions analyzed: The uncertainty of the concentration measured by the software is lowered as the number of analyzed droplets increases. The number of partitions obtained for this experiment was between 21,000 and 27,000 per well.
- The ability to visualize the spatial position and the fluorescence levels of the partitions allows the users to have high confidence in the included and excluded partitions for robust results. This data transparency also allows both to verify that the target distribution in the droplets follows a Poisson distribution and to monitor the intensity and spatial uniformity of the fluorescent signal in the droplets. Stilla’s Crystal Miner software allows this type of monitoring and is fully transparent.
b. Setting the threshold
- Three different populations are obtained from a drop-off experiment (Figure 2). The 1st quadrant population provides the number of droplets including wild-type targets, the 4th quadrant population provides the number of droplets including mutants and the 3rd quadrant population is the number of double negative droplets. Quadrant 2 is empty by design.
- For a clear separation between the three populations of interest, it is important to verify that a threshold has been correctly set for the blue and red channels. This threshold is set automatically by the Crystal Miner software.
c. Calculating the concentration of the target DNA
- The Mutant Allelic Fraction (MAF) is the ratio of the estimated concentration of mutant DNA and the estimated concentration of the total DNA (see the formula in Results and Conclusion).
- It is important to note that co-encapsulation of the mutant and WT DNA can occur randomly in some droplets, leading to double-positive droplets that are indistinguishable from the WT DNA-only containing droplets. As such, it is important to deduct this double-positive population when calculating the mutant concentration so as not to underestimate the mutant DNA concentration.
- The concentration of the mutant DNA can be calculated from the proportion of droplets that are single positive for FAM among the droplets that are not double-positive (i.e. single FAM positive or double negative).
- The concentration of total DNA can then be obtained by summing the wild-type concentration and the mutant concentration.
Conclusions
The data can be exported from the Crystal Miner software (or the software used for data acquisition) as an excel sheet. Following Poisson law, the MAF can be calculated.
A detailed and state-of-the-art description of the method for calculating the confidence interval of a ratio of concentrations can be found in the literature, see:
https://pubmed.ncbi.nlm.nih.gov/18682853/
https://www.ncbi.nlm.nih.gov/pmc/articles/PMC3367212/
Briefly,
Cmut = −1/v(ln(1−(P10)/(P10+P100)))
where v is the average partition volume (in µl) and C is the mutant concentration (in copies/µl).
And,
CWT=−1/v(ln(1−(P11)/(P11+P00+P10)))
To determine the MAF, this formula can be used: MAFdropoff = (CMut)/(CWT+CMut)
For this experiment, the results are as shown in the results table below. Serial dilutions of mutant DNA ranging from 500 to 25 copies/µl in a background of 10,000 copies of WT DNA were performed to achieve mutant allele fractions ranging between 5- 0.25%. The final result was a detection level of 0.3% MAF in a background of ~330 copies/µl of the sample.
Also, for our data, the relative uncertainty was obtained from the WT and the mutant. The relative uncertainty here has a high value owing to the large uncertainty of the mutant fraction because the sample we assayed has a low concentration of rare mutations. This value points to the need for high precision and sensitivity, as the level of detection depends on the sensitivity of the digital PCR system used.
To summarize a drop-off assay:
- One of the major advantages of running a Drop-off assay is the power to detect multiple proximal genetic lesions (insertions, deletions, and nucleotide substitutions) within a short genomic interval using a single assay.
- For therapeutic monitoring in cancer patients, a set of predictive genetic markers is monitored in clinical settings. For example, in colorectal cancer patients, KRAS and NRAS proto-oncogene mutations indicate resistance to anti-EGFR.
- In this tutorial, one set of WT and Reference probes were used to detect up to 7 mutations that occur in colorectal carcinoma in the KRAS.
- A drop-off assay is a cost-effective and rapid assay for the simultaneous screening of a wide range of clinically relevant genetic alterations.
For detailed instructions and guidelines for reporting and publishing data and results obtained from a Digital PCR experiments, see the MIQE Guidelines Item here:
Congratulations on successfully performing this digital PCR experiment!
Want to discover more dPCR experiments?
Check out our other tutorials!