Ruby Chip — high quality Crystal Digital PCR™ consumable prevents PCR cross-contamination to ensure accurate quantification of nucleic acids with the naica® system
INTRODUCTION
DNA polymerase and PCR assays are highly susceptible to contamination. Many PCR applications operate multiple samples on the same consumable. Thus, contamination can be carried through across DNA sequence copies. Good laboratory practice (GLP) in combination with smart PCR consumable design helps to reduce the risk for any sample cross-contamination, which is important for high sensitivity applications, such as digital PCR.
General GLP recommends protecting the reaction mix from genomic DNA and reducing the risk of cross-contamination from the amplicon/template and previous reactions. This Technical Note demonstrates that the naica® system chip consumable, Ruby Chip, by design prevents the Crystal Digital PCR™ experiment from having any intra-run and inter-run cross-contamination, providing high quality quantification results on the naica® system.
MATERIAL & METHODS
Materials
Crystal Digital PCR™ tests have been performed using the Ruby Chip with the naica® system instruments: Geode for the Droplet Crystal partitioning and PCR amplification; 3-color naica® system (Prism3) for the scan of 3-plex assay; and 6-color naica® system (Prism6) for the scan of 6-plex assay (Table 1). Positive control samples and NTC (No Template Control) samples were altered within the same Ruby Chip for the control of intra-run contamination, and between run for the control of inter-run contamination. The intra-run contamination studies were performed with an internal 3-plex and 6-plex assay while the inter-run contamination studies were performed only with the 3-plex assay. Intra-run contamination corresponds to the contamination of a chamber by the sample present in a neighboring chamber, while inter-run contamination corresponds to contamination generated by samples that have been processed in previous experiments in the same Geode instrument for partitioning and amplification. A detailed description of the two assays is depicted in Table 1.
Methods
To evaluate the results, the concentration obtained for the NTC chambers were directly compared to the specific LoB (Limit of Blank) obtained for these assays. Stable LoB values across all samples are the expected result for the study in order to demonstrate that there is no occurrence of cross-contamination. Elevated levels of LoB are considered an indicator for contamination within the experiment. The LoB value of these internal assays with the Ruby Chip were determined using an adapted version of the Clinical and Laboratory Standards Institute (CLSI) EP17-A2 standard (Protocols for Determination of Limits of Detection and Limits of Quantitation; Approved Guideline). The complete procedure to determine the LoB using the naica® system is described in a specific technical note: “How to characterize the Limit of Blank and the Limit of Detection in Crystal Digital PCR™”. According to the EP17 standard the LoB value for a given target is defined as the 95th percentile highest concentration when processing at least 30 replicate reactions in which the target template is excluded (blank samples).
As the LoB value is defined as the 95th percentile concentration, the percentage of NTC chambers above the LoB should be less than 5% during the cross-contamination studies when at least 30 NTC chambers are processed.
Assay characterization
The targets, their concentrations for the positive samples, and the reference value for LoB are described in Table 1.
| Internal test assays Target | Channel | Concentration of positive samples (cp/µL) | Reference value for LoB (cp/µL) |
| BRAF* | Blue | 690 | 0.33 |
| 3-plex assay pUC18 MCS L1** | Green | 10360 | 0 |
| ALB* | Red | 690 | 0 |
| Phage Lambda** | Blue | 830 | 0 |
| Phix 174** | Teal | 570 | 0 |
| pUC18 MCS L1** | Green | 8430 | 0.12 |
| 6-plex assay pBR322** | Yellow | 1170 | 0 |
| Enterobacter cloacae** | Red | 575 | 0 |
| ALB* | Infra-Red | 615 | 0 |
RESULTS
Intra-run contamination studies
To evaluate intra-run contamination, positive and NTC samples were alternated within the same chips. The tests were performed with the 3-plex assay (2 x 3 chips) and the 6-plex assay (3 chips) according to the Ruby Chip loading plan described in Figure 1.
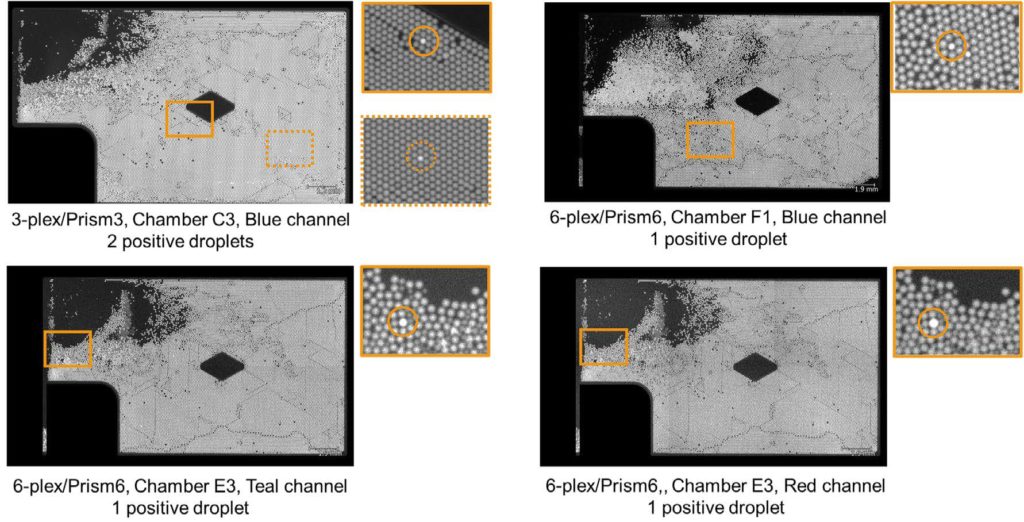
The percentage of NTC chambers with concentration above the reference LoB value obtained for the 3-plex assay and the 6-plex assay are depicted, respectively, in Tables 2 and 3. For both assays, less than 5% of the NTC chambers showed a higher concentration than the reference LoB value. No intra-run contamination was thus observed during this study.
The Droplet Crystal images of chambers with concentration above the LoB are shown in Appendix 1/Figure 2.
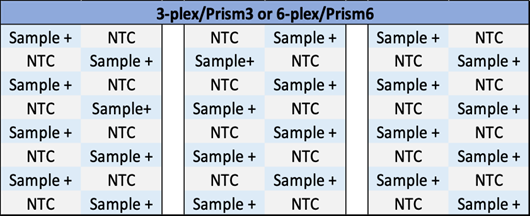
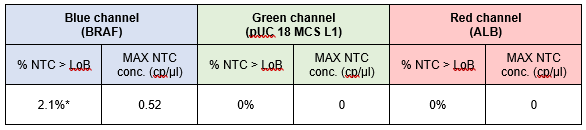
Table 2 | Quantification of NTC samples obtained for the 3-plex assay (evaluated on 48 NTC chambers).
Inter-run biological contamination studies
To evaluate inter-run biological contamination, two Crystal Digital PCR™ runs were performed with positive samples followed by four runs with NTC samples. The tests were performed with the internal 3-plex assay using the same instruments to evaluate a potential contamination (3-color naica® system / Geode and Prism3 instruments).
The results of the first NTC run were analyzed first, as this run is performed just after processing the positive samples and could potentially be more affected by an inter-run biological contamination. Then, the results for the three following runs were analyzed and pooled with the first NTC run. The percent- age of chambers above the LoB are depicted in Table 4. For the first run of NTC chambers, less than 5% of the NTC chambers showed a higher concentration than the LoB. This result demonstrated that no biological contamination occurred between the two runs of positive samples and the next NTC run.
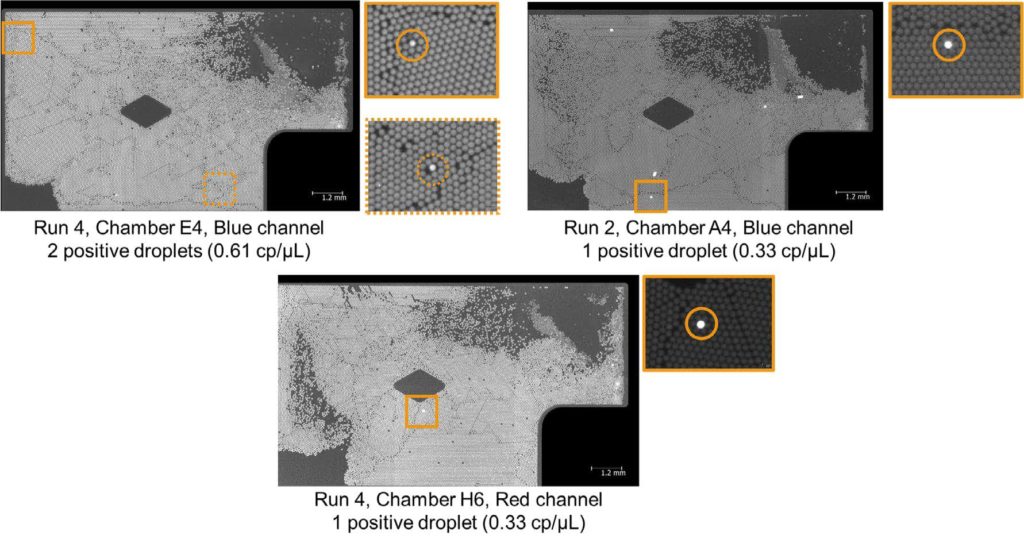
When analyzing the results obtained from the four pooled NTC runs, less than 5% of NTC chambers showed a concentration higher than the LoB values in the green and the red channel while the percentage of chambers with a concentration higher than the LoB in the blue channel was just above the 5% target (6.3%). Nevertheless, the concentrations found during these NTC runs were lower than the LoB max (which consider the Poisson distribution error) suggesting that no contamination occurred during these experiments.
The Droplet Crystal images of NTC chambers with the highest concentrations are shown in Appendix 2/Figure 3.
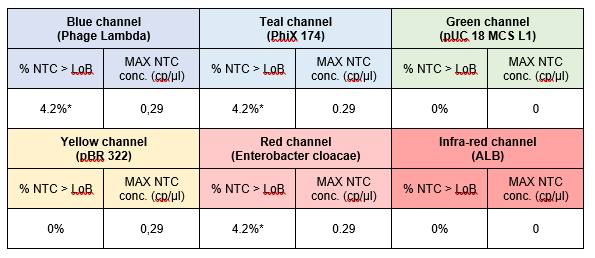
Table 3 | Quantification of NTC samples obtained for the 6-plex assay (evaluated on 24 NTC chambers).
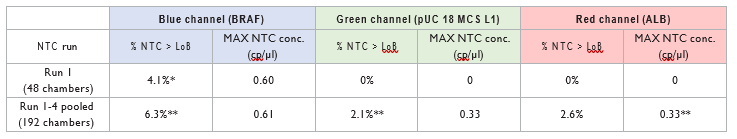
**6.3%, 2.1% and 2.6% corresponds respectively to 12/192, 4/192 and 5/192 chambers with concentration above the LoB.
Table 4 | NTC samples quantification obtained for the validation 3-plex assay.
Conclusion
Digital PCR is applied to detect targets at very low abundances and thus is known as a high-sensitive application. The control of cross-contamination is one of the critical steps for accurate and reliable results. This Technical Note demonstrates the prevention of intra- & inter-run cross-contamination by design of the naica® system chip consumable, Ruby Chip. The results demonstrate no intra-run contamination and no inter-run contamination occurred during these experiments, as no chamber showed a higher concentration than the limit of blank (LoB) maximum.