
Advanced Threshold Setting
When the different populations are not well separated, automatic thresholding fails and must be manually adjusted. The threshold is usually set using horizontal or vertical bars.
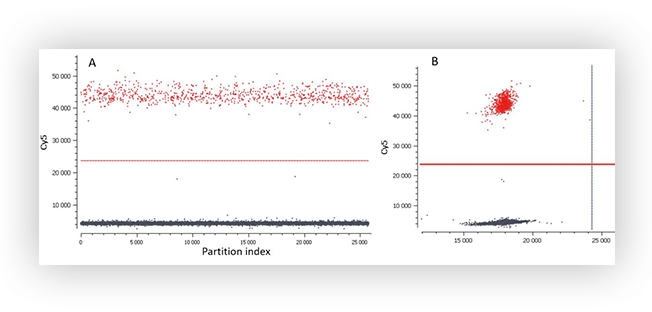
1D dot-plot
When a single fluorophore assay is used, the 1D dot-plot enables manual threshold setting
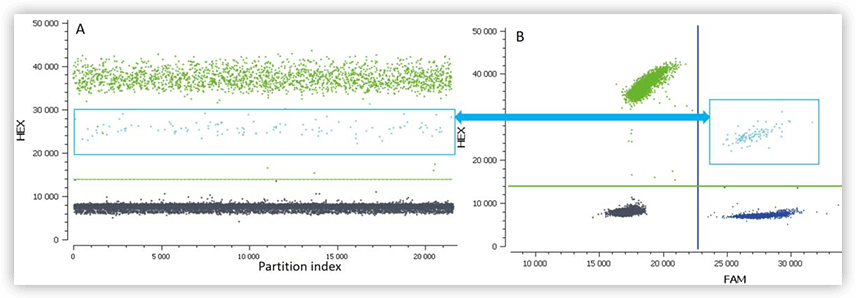
Fluorescent assays
When two or more fluorescent assays are used, it is advised to visualize the 2D dot-plot of the results to verify if both thresholds are correctly set. Furthermore, the visualization using 2D dot-plot can be useful to understand how populations are distributed.
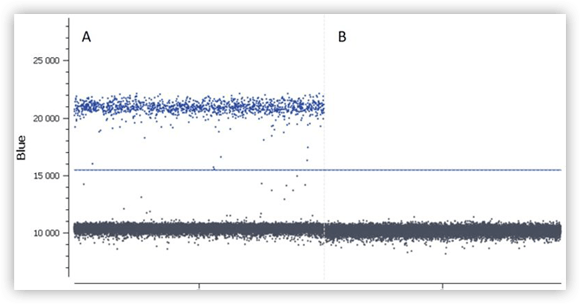
Manually adjust the threshold
Finally, if you need to manually adjust the threshold, do not forget to have a look at the wells containing your positive and negative controls included in each experiment. They provide information that can be useful for threshold setting.
Want to discover more dPCR experiments?
Check out our other tutorials!