
Introduction
Nowadays, all digital PCR instruments available on the market provide multiplexing capability with at least two different detection channels. Fluorescence experiments using multiple fluorophores are commonly set up to detect a unique fluorophore per acquisition channel. However, depending on the fluorophore used, as well as the specifications of the instrument used for acquisition, the signal from a given fluorophore may be detected in more than one channel. This is designated as fluorescence spillover (also called bleedthrough or crosstalk) and it can be encountered in other techniques using fluorescence such as microscopy, real-time PCR or FACS.
Some digital PCR instruments will automatically perform the correction of this phenomenon by applying the same correction factor on all your different experiments. On the other hand, some digital PCR platforms will allow you to create your own compensation matrix. This can be very useful since fluorophores can behave differently depending on their environment.
Understanding Fluorescence Spillover
To understand what is happening in fluorescence spillover, let’s consider 2 fluorophores with overlapping excitation and emission spectra, such as FAM and Yakima Yellow.
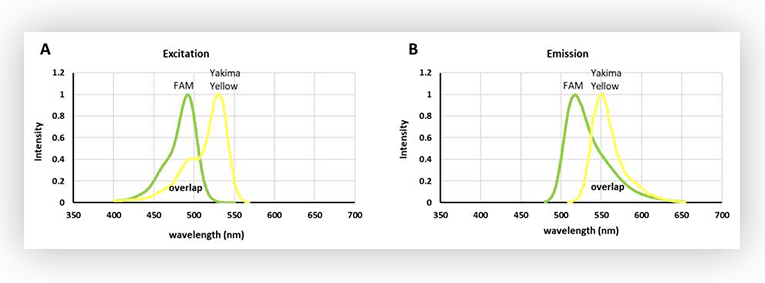
As shown in Figure 1, there is an extensive overlap between the excitation spectra of FAM and Yakima Yellow. In fact, Yakima Yellow can be excited at almost any wavelength used to excite FAM, although to a lesser extent. So, this means that Yakima Yellow will fluoresce when a light source for exciting FAM is used.
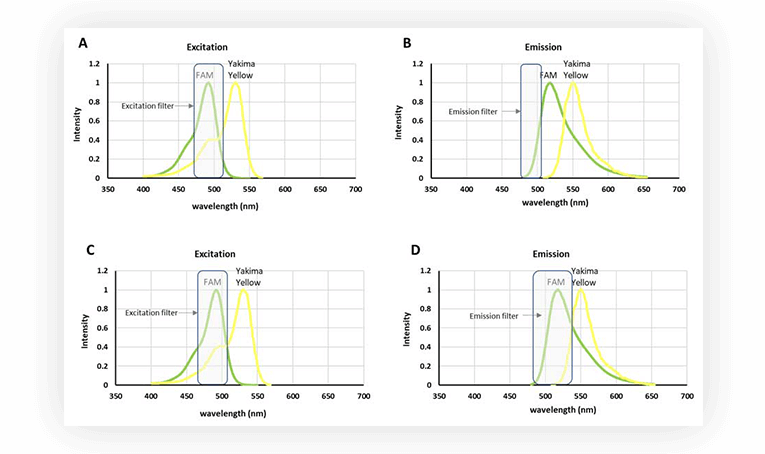
However, set ups for fluorescence acquisition are usually equipped with filters to discriminate the signal. So even if Yakima Yellow is fluorescing, it is possible to acquire only the fluorescence stemming from FAM, by using a narrow filter, at wavelengths where Yakima Yellow fluorescence is marginal (Figure 2.B). An alternative is to have a filter with a wider bandpass (Fig.2.D), thus harvesting more fluorescent signal from FAM, and correcting the interfering signal from Yakima Yellow in post-processing.
As the numbers of fluorophores increase within an experiment, overlap between spectra is practically unavoidable, hence it is important to consider the post-processing correction, called fluorescence spillover compensation.
Identification
How can you identify fluorescence spillover in a digital PCR experiment?
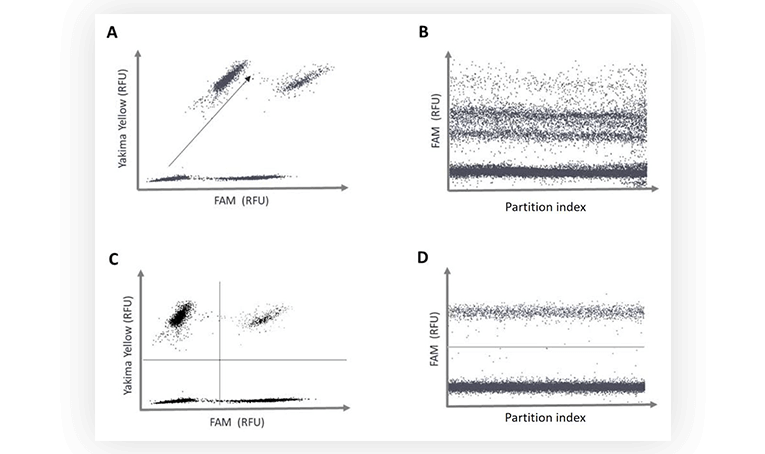
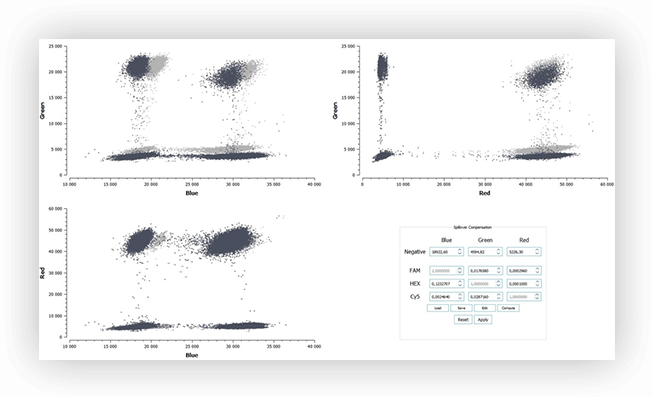
Fluorescence spillover can be identified on 2D dot-plots. Indeed, the increase of fluorescence intensity of a positive population in channel 1 correlates with an increase of fluorescence intensity of the same population in channel 2. The result is that the populations are not orthogonal when visualized as 2D. When data is projected on a 1D dot-plot, this means a second population will be present, sometimes rendering thresholding difficult (Figure 3B).
After spillover compensation, the populations are placed orthogonally on the 2D dot-plot, no additional populations appear on the 1D dot-plot, and the thresholds can be readily placed (Figure 3C and 3D).
It is important to note that such observations can also stem from a probe cross-specificity issue, or a physical linkage between the targets assayed, hence it is essential to differentiate these biochemical or biological effects from a strictly optical one such as fluorescence spillover.
Correction
How do you correct the fluorescence spillover?
1.Experimental set-up
Before routinely running your samples with a dedicated assay, you will have to create and save a “compensation matrix”. A compensation matrix allows recovering 2 (or more) fluorescence values emitted by 2 (or more) possible fluorophores contained in a given partition. To do so, you need to run an experiment with wells dedicated to mono-color controls. These controls are used to compensate the fluorescence spillover.
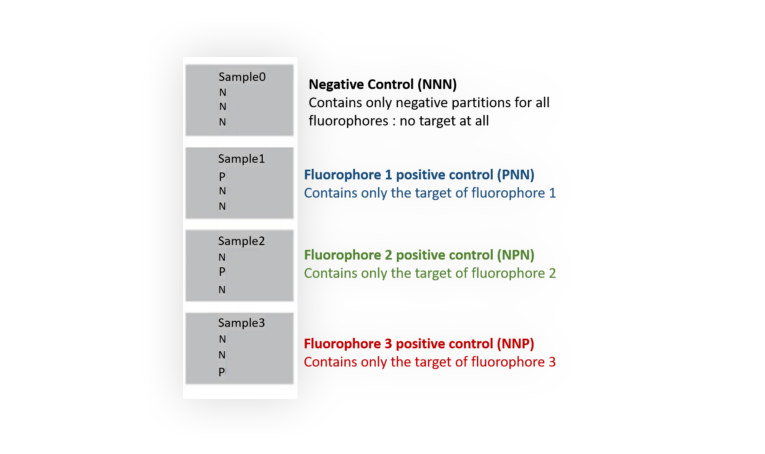
Let’s say you need to build a compensation matrix for an assay with 3 different fluorophores.
You need to prepare 4 different mixes that will be loaded into 4 wells as shown in Figure 4. In each mix, all probes must be included.
2. Mathematical correction
The fluorescence readout instrument is typically based on M fluorescence channels, which means a set of M detection channels will be used to detect M standard or custom fluorophores.
We assume that the main detection channel of the fluorophore k is the source k. The partial excitation of the fluorophores by the sources can be represented by the M×M excitation matrix E where:
- E(k,k)=1
- E(i,j), with i≠j, is an excitation percentage representing the partial excitation of the fluorophore i by the source j
In order to recover the vector X of M fluorescence values emitted by the M possible different fluorophores contained in a given partition, a compensation matrix should be applied to the vector Y of M fluorescence values recorded for this partition. This compensation matrix is a transformation which transfers the M partition coordinates from the “Light domain” to the “Fluorophore domain”.
The resulting spill-over formula is:
- X=inv(E) (Y–T)+T
where:
- inv(E) is the inverse of the excitation matrix E
- T is the translation vector corresponding to the background fluorescence of the partition
To conclude, when performing digital PCR experiments with 2 or more fluorophores, make sure that fluorescence spillover is corrected for, whether through hardware or post-processing, depending on the instrument used. If unsure, please contact your manufacturer for more information on how fluorescence spillover is dealt with.
Want to discover more dPCR experiments?
Check out our other tutorials!