Quantify Drop-off for digital PCR assays with Crystal Miner
How to interpret Drop-Off digital PCR assays using Crystal Miner
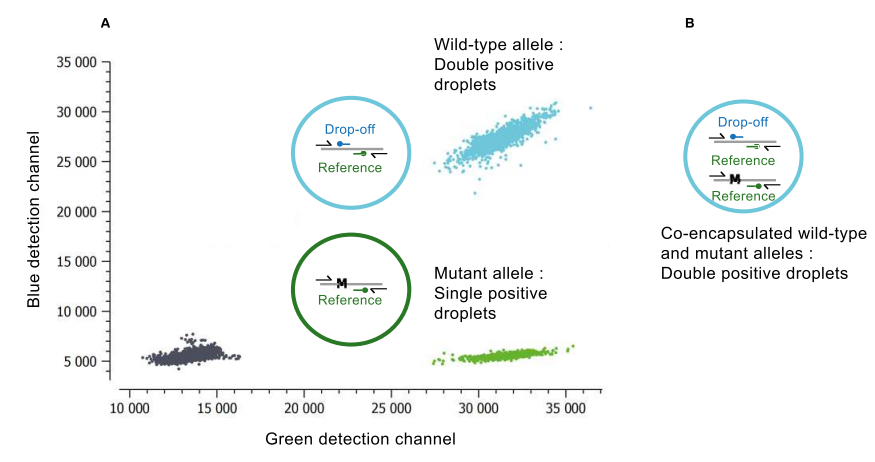
- A 1st channel to detect the Drop-Off Probe that spans the mutation site but is uniquely complementary to the wild-type sequence (e.g. “blue Detection Channel” on the vertical axis in Fig. 1)
- A 2nd channel to detect the Reference Probe that hybridizes adjacent to the mutation site and is complementary to both the mutant and wild-type alleles (e.g. “Green Detection Channel” on the horizontal axis in Fig. 1)
In the presence of a wild-type allele, both the drop-off and reference probes willl hybridize with their target, leading to a double positive signal (turquoise population in Fig. 1). Whereas in the presence of a mutant allele, even a single nucleotide mutation is enough to destabilize the hybridization of the drop-off probe so that only the reference probe anneals to its target leading to a single positive signal (green population in Fig. 1)
For more information on Drop-off assay design, see our Application Note “Drop-off Crystal Digital PCR™ detects NRAS, KRAS, EGFR mutations” at Application Notes
Step-by-step method to quantify Drop-Offs using Crystal Miner
The wild concentration \(C_{WT}\) can be directly derived from the proportion \(P_{WT}\) of droplets that are double-positive (whether they are positive or negative in a 3rd detection channel). However, the drop-off mutant concentration \(C_{MUT}\) must be derived from the proportion \(P_{MUT}\) of droplets that confidently contains mutant alleles. Due to the potential for wild-type and mutant allele co-encapsulation, double-positive droplets are ambiguous droplet for mutant quantification. As such, \(P_{MUT}\) can only be determined by excluding the double-positive droplets and thus restricting the mutant positive population to the droplets that are positive for the Reference Probe but negative for the Drop-Off Probe (whether they are positive or negative in 3rd detection channel).
To quantify Drop-off populations using Crystal Miner, follow the steps below:
1. Define the three droplet populations: mutant positive, mutant negative, wild-type positive
- Go to ANALYZE DATA > Plots & Populations > 2D dot plot
- Select the “Polygon” type for the thresholding mode, then select your well(s) of interest in the left-hand panel
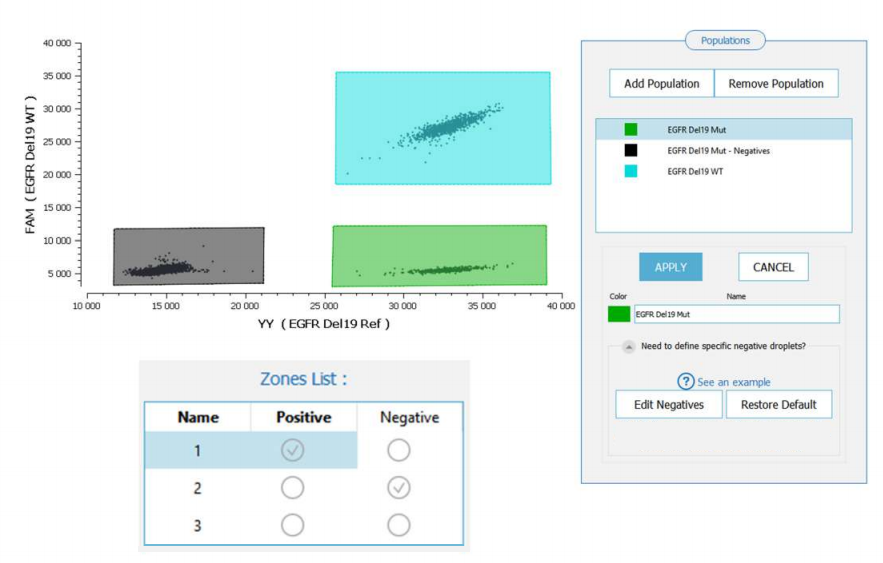
- In the 2D dot plot showing the “Drop-Off Detection Channel” on the vertical axis and the “Reference Detection Channel” on the horizontal axis (double-click on the axes to modify their Channel attributions if needed), draw a polygon around each of the following three droplet populations of interest:
- Mutant positive population, discounting double positives (e.g. “EGFR del 19 Mut” in Fig. 2)
- Mutant negative population, discounting double positives (e.g. “EGFR del 19 Mut – Negatives” in Fig. 2)
- Wild-type positive population, i.e. the double positive (e.g. “EGFR del 19 WT” in Fig. 2)
To draw a polygon: press and hold the Ctrl key and right-click to create each vertex, then release the Ctrl key before the last right-click to close the polygon. You can then name the droplet population contained in the polygon and choose its color.
2. Specify the negative population associated with the mutant positive population/p>
- Go to ANALYZE DATA > Plots & Populations > Population Editor
- In the “Population” window on the right: select the mutant positive population, then click on “EDIT”, expand the option “Need to define specific negative droplets” and click on “Edit Negatives”
- In the “Zones List” window in the middle: check the box corresponding to the mutant negative population in the “Negative” column (e.g. the zone “2” in Fig 2)
- In the “Population” window on the right: click on “APPLY”
3. Calculate the MAF of a drop-off mutant
- Go to VIEW RESULTS > Result Table and get the drop-off mutant concentration \(C_{MUT}\) and the wild-type concentration \(C_{WT}\) automatically estimated by Crystal Miner
- Go to Export and export all result data
- Deduce the MAF of drop-off mutant by applying the following formula: \(MAF_{dropoff}\) = \(C_{MUT}\) ( \(C_{WT}\) + \(C_{MUT}\) )
Notes
The relative loss of Limit of Detection (LOD) for a drop-off mutant compared to the LOD of a point mutant increases exponentially with the expected wild-type concentration (e.g. LOD at 95% confidence level raises from 0.2 to 0.27 cp/µL for a wild-type concentration \(C_{WT}\) =500 cp/µL in the loaded sample of one Sapphire chip well).
If the double-positive droplets are not excluded and instead counted as mutant negative droplets, the MAF of the drop-off mutant will be underestimated almost linearly according to the expected wild-type concentration \(C_{WT}\) and with a nearly constant factor for any \(C_{MUT}\) \(\leq\) 100 cp/µL (e.g. underestimation around 25% for \(C_{WT}\) =500 cp/µL in the loaded sample). ln addition, keeping the double-positive droplets would neither decrease the relative uncertainty of the measured drop-off mutant concentration nor the LOD of the drop-off mutant.
Technical Note Highlights
- By using the Naica™ Crystal Miner advanced Population Editor feature, ambiguous droplets can be discounted ensuring accurate quantification of drop-off mutations
- Excluding ambiguous droplets avoids underestimating the concentration of the drop-off mutant without decreasing the concentration measurement precision
- Because only two detection channels are required to estimate a drop-off mutant allelic fraction, the third detection channel can be used, for example, to add an internal amplification control or to simultaneously quantify the MAF of a point mutation (see the Application Note “Drop-off Crystal Digital PCR detects NRAS, KRAS & EGFR mutations” at Application Notes).