Product demonstration — integration of automated liquid handling of the Ruby Chip enables a fully integrated workflow solution for high-throughput Crystal Digital PCR™
Integrating a liquid handling solution in the workflow of a lab allows researchers to gain in productivity and in reproducibility. With the Ruby Chip, Stilla Technologies offers a Crystal Digital PCR™ consumable compatible for integration with automated sample preparation as well as chip consumable loading. The possibility of utilizing automated liquid handling for the preparation of all required chip consumables allows the integration of the naica® system with walk-away organization of lab work.
With a straightforward and simple to implementation protocol, sample processing and Ruby Chip preparation will be shown, corresponding to a maximum throughput per day using the naica® system.
MATERIAL AND METHODS
Material
All experiments used an exemplary custom made 6-plex assay including the 10X naica® multiplex PCR MIX.
The fully automated Ruby Chip loading was performed using the Opentrons OT-2 Lab robot, with Opentrons 20-µL filter tips. A customized chip holder for fixation of chip positioning was engineered by Stilla Technologies for the Ruby Chip workflow integration.
Crystal Digital PCR™ was performed using the automated loaded Ruby Chip consumables on the 6-color naica® system.
Methods
Ruby Chip consumables were processed for anti-static treatment as described in the Ruby Chip Instruction for Use.
Ruby Chip consumables were placed in the customized Ruby Chip holder, to ensure the defined position in all dimensions of the Ruby Chip in the Opentrons OT-2 Lab robot layout.
For chip loading, the sample reaction mix of the 6-plex assay was provided in a standard 96-well plate.
The protocol used to automatically pipette the sample mix in the Ruby Chip consumables was a custom protocol. The first step of the protocol is Ruby Chip well piercing. Ruby Chip well
piercing is an important process step to ensure there is no over- pressure when injecting the sample mix, as overpressure could lead to only partial injection of the sample mix. To pierce the Ruby Chip wells the protocol was programmed to use empty pipetting tips. These empty tips were injected at a depth of 4 mm into the protective foil covering each individual Ruby Chip well in order to open the well for the following sample mix injection step. To avoid the risk of cross-contamination, the pipette tips used for Ruby Chip wells piercing were discarded. The protocol was programmed to use a new set of pipette tips to collect a specified volume (5.2 µL) of sample mix from the 96-well plate and to inject 5 µL of sample mix in each well, at a programmed depth of 7 mm from the top of the well.
To compare the results obtained with the automated loaded Ruby Chip consumables, the mix was prepared using manual single channel pipette loading protocols for the Ruby Chip as described in the Instruction for Use.
RESULTS
Loading time
- The complete automated loading time of three Ruby Chip consumables using eight channels pipetting is four minutes.
- The complete manual loading time of three Ruby Chip consumables using single channel pipetting is twelve minutes.
Chip preparation method for increased efficiency
It is possible to wait up to eight hours between Ruby Chip loading and Crystal Digital PCR™ processing on the naica® system. As shown in Table 1 microfluidic performances are comparable in both cases, with a mean number of droplets of about 17,000, and a coefficient of variation around 10%. The concentration measurements and repeatability were below 6%/4.1%/5.7% for measurements in the blue/green/red channels, respectively. The results indicate there is no additional uncertainty added by eight hours waiting time between loading of the chip and the Geode run (Table 2).
| Conditions | Droplet number (mean) | Droplet number (CV%) |
| T0 | 17312 | 10.40% |
| T8h15 | 16574 | 12.06% |
| Conditions | Blue channel | Green channel | Red channel | |||
| Concentration (CV%) | Deviation Concentration / Concentration of reference | Concentration (CV%) | Deviation Concentration / Concentration of reference | Concentration (CV%) | Deviation Concentration / Concentration of reference | |
| T0 | 5.28% | 93.72% | 4.56% | 95.45% | 5.29% | 92.84% |
| T8h15 | 4.93% | 100.30% | 4.38% | 101.73% | 5.61% | 98.74% |
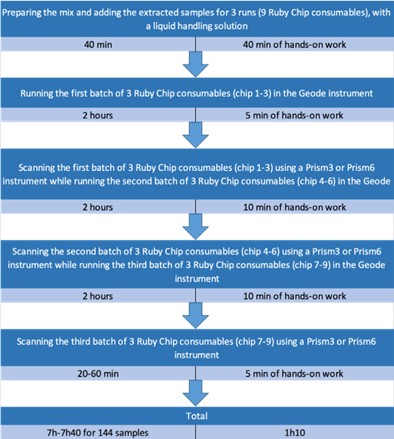
Being able to wait up to eight hours allows for increased efficiency by preparing in advance all the Ruby Chip consumables before running all Crystal Digital PCR™ runs in a row. It takes slightly more than one hour of manipulation to process 144 samples in a day, with all the labor intensive steps at the beginning of the day, described as follows:
COMPARISON OF AUTOMATED AND MANUAL RUBY CHIP LOADING
Microfluidic performances
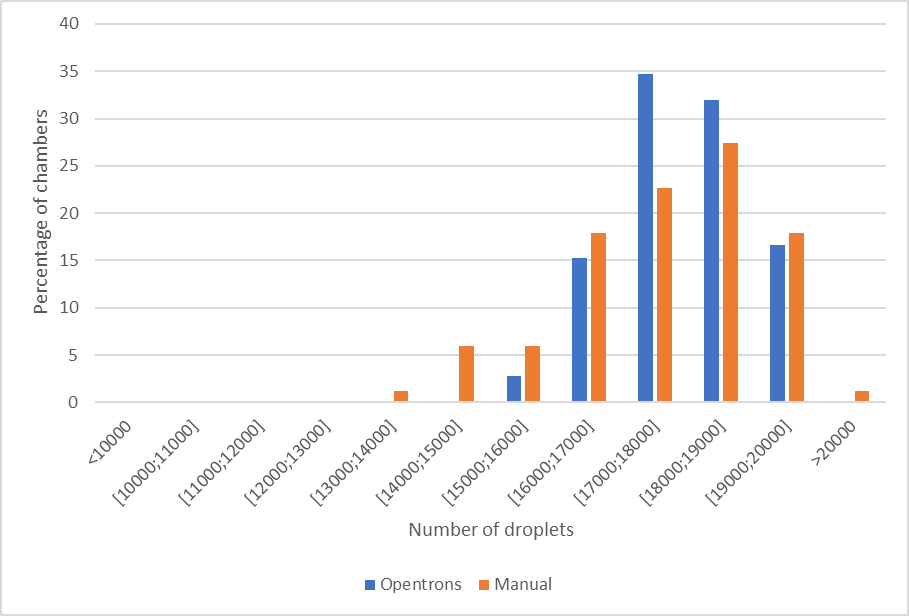
Figure 3 and Table 3 show that performances regarding the droplet count of the Opentrons OT-2 Lab robot are comparable to those of manual loading.
Automated pipetting shows a mean number of droplets of 17,680 against 17,142 for manual loading, indicating 3.1% more droplets for automated pipetting for Ruby Chip loading (Figure 3, Table 3).
Automated loading proves to be more repeatable in this experiment, with a coefficient of variation for the number of droplets around 5% for automated loading and 8% for manual loading (Table 3).
On average the results for automated Ruby Chip loading compared to manual Ruby Chip loading showed higher droplet counts above 17,000 droplets (automated loading 80% of all chambers / manual loading 70% of all chambers).
Ruby Chip droplet numbers
| Conditions | Mean nb of droplets | (CV%) | % chambers > 15000 | % chambers > 17000 |
| Opentrons | 17680 | 5.48 | 100 | 82.19 |
| Manual | 17142 | 8.31 | 98.82 | 67.06 |
Biomolecular performance
Reasons for the uncertainty of concentration measurements are indicated by different sources: (1) the uncertainty due to the statistical nature of the phenomenon we are measuring, being the number of positive droplets, following Poisson’s law. It is characterized by the coefficient of uncertainty, defined by the ratio of the theoretical standard deviation in concentration by the mean concentration. And (2) the added uncertainty by the experimenter during the chip loading process.
The coefficient of variation (defined by the ratio of the empirical standard deviation in concentration by the mean concentration) accounts for both sources of uncertainty.
Thus, the coefficient of variation is necessarily greater than the theoretical coefficient of uncertainty.
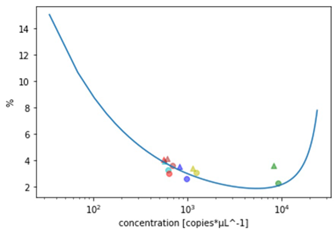
Figure 4 shows the coefficient of uncertainty in function of the concentration (blue curve), and the coefficients of variation (dots for loading with the OT-2, and triangles for manual loading). The closer the coefficients of variation are to the blue curve, the lower the uncertainty due to the loading process.
As shown in Table 4 and Figure 4, the coefficients of variation (CV) for both loading methods not only compare with each other but also with the coefficient of uncertainty (CU), meaning a negligeable uncertainty due to both pipetting processes. This demonstrates the reliability and repeatability of the Ruby Chip consumables for Crystal Digital PCR™ on the naica® system, both with manual and automated loading.
Note that some points show a CV lower than the CU. This is because the measured CV is a statistical estimator, the confidence interval of which decreases with the number of experiments. Thus, with an increased number of repetitions the CV value converge towards a value greater than the CI.
| Conditions | Blue | Teal | Green | Yellow | Red | Infra-Red | ||||||
| Concentration cp/μL (Mean) | Concentration (CV%) | Concentration cp/μL (Mean) | Concentration (CV%) | Concentration cp/μL (Mean) | Concentration (CV%) | Concentration cp/μL (Mean) | Concentration (CV%) | Concentration cp/μL (Mean) | Concentration (CV%) | Concentration cp/μL (Mean) | Concentration (CV%) | |
| Manual loading | 825.94 | 3.56% | 563.91 | 3.97% | 8257.93 | 3.60% | 1141.00 | 3.43% | 566.43 | 4.11% | 607.26 | 4.15% |
| Opentrons | 964.39 | 2.64% | 622.27 | 3.30% | 9109.25 | 2.29% | 1242.96 | 3.08% | 633.89 | 3.00% | 686.38 | 3.62% |
Conclusion
The Ruby Chip presents a consumable for the integration of automated, reliable, and reproducible sample preparation and chip loading for Crystal Digital PCR™ workflow integration. The integration of sample mix preparation and chip loading allows researchers to optimize laboratory processes for standardization, increased efficiency, and a walk-away organization. Using the Opentrons OT-2 lab robot, we can divide loading time by three for every batch of 3 Ruby Chip consumables. Combined with the fact that it is possible to wait up to eight hours between Ruby Chip loading and Crystal Digital PCR™ processing on the naica® system, this allows for loading several batches in a row, for a walk- away organization of lab work. Doing so, it is possible to analyse up to 144 samples for only 1h10 of hands-on work. Furthermore, using the Opentrons OT-2 lab robot, up to 80% of chambers exceeded the 17,000-droplet claim, and variability due to pipetting errors was reduced close to the theoretical minimum.
Learn more about what the Nio®+ instrument and Crystal Digital PCR™ can do for your research