Precision performance of Crystal Digital PCR vs. quantitative PCR
Experimental Setup
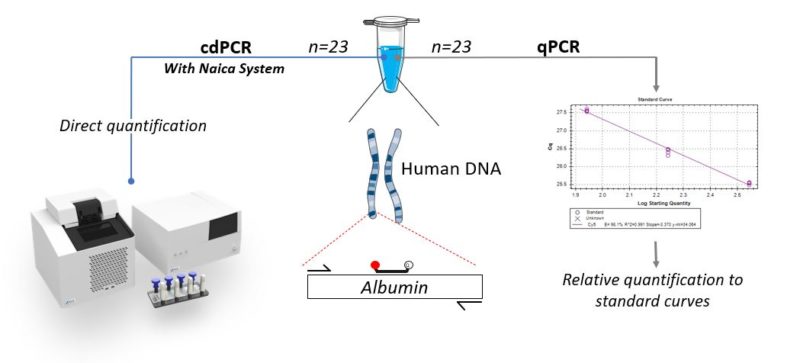
Real-time PCR quantification, also called quantitative PCR (qPCR) compares cycle quantification (Cq) values of unknown samples to that of standards containing known amounts of nucleic acids. Contrary to qPCR, digital PCR (dPCR) enables absolute quantification without the need for a reference standard. Digital PCR systems claim to provide higher precision and reproducibility than qPCR. Here, we compare the precision and reproducibility of the Crystal Digital PCR™ (cdPCR) technology using the Naica™ System to that of qPCR technology. In this study, we made conscious efforts to reduce the experimental variability in order to evaluate only the variability inherent to the technology. We compared the quantification variability of 23 qPCR and cdPCR technical replicates from a single unique PCR master mix spiked with a final concentration of 175 cp/µl of human genomic DNA. The same experimenter and equal final volumes of 25 µL were used to quantify the target gene Albumin (ALB) for both techniques (see experimental setup, Fig. 1).
Assay Validation and Quantification
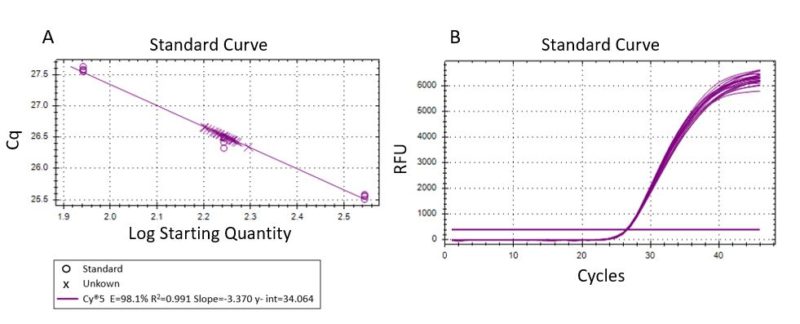
Generally, qPCR standard curves are generated from a different matrix (commercial DNA or standardized samples) than the experimental samples being assayed. The amplification efficiency is not systematically determined for each sample but based instead on a qualitative internal positive control. Thus, the presence of inhibition or non-specific amplification cannot be fully evaluated. In this study, we simultaneously performed standard curves and sample quantification using
the same DNA matrix. Standard curve analysis must have a coefficient of determination (R2) ≥0.990 (1). A high efficiency of 98.1% (R2 = 0.991) was obtained (Fig. 2A) within the range of quantification (Fig. 2B).
1. AppliedBiosystems 2004. Amplification efficiency of TaqMan® gene expression assays.
As cdPCR allows direct quantification, there is no need to utilize standard curves. In addition, cdPCR is less sensitive to PCR inhibiting molecules naturally present in DNA extractions (for more information, see application note about effect of inhibitors on digital PCR. Indeed, in cdPCR, direct quantification can be determined as long as clear thresholds distinguishing positive and negative clusters can be defined automatically by the Crystal Miner software or manually by the experimenter.
Comparison of Precision Performance
From the same PCR master mix, 46 technical replicates were created and split into two test sets of 23 sample replicates. These were then measured and compared using qPCR and cdPCR (Fig. 3A). A total of 604,867 droplets were generated for the 23 samples analyzed in cdPCR, thus an average of 26,299 droplets generated per sample. Bessel-corrected coefficient of variation (%CV) was calculated for each set of values (Fig. 3B). The respective CV values show that the measurement variability of cdPCR (%CV= 2.3) is more than 2-fold less than that of qPCR (%CV= 5.0).
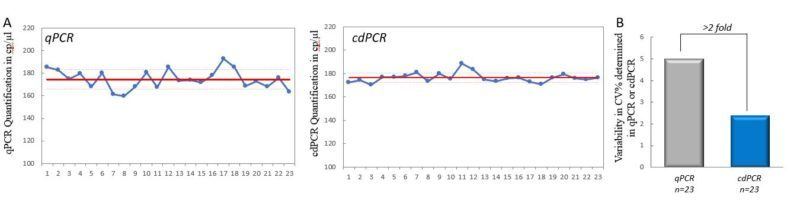
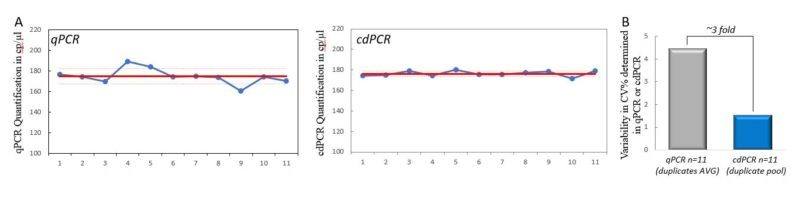
Importantly, cdPCR allows sample replicates to be pooled and analyzed as a single larger sample. Here, we compared cdPCR pooled in groups of two to the averages of 11 separate duplicates in qPCR. When cdPCR replicates are pooled, the measurement variability of cdPCR (%CV=1.5) is almost 3-fold less (65.9%) than that of qPCR duplicates average (%CV=4.4) (Fig. 4A and 4B). Indeed, the higher the number of pooled wells, the higher the total analyzed volume and the total number of analyzed droplets, thus lowering both the sampling error and the partitioning error, resulting in a decrease in the quantification uncertainty.
Technical Note Highlights
- Crystal Digital PCR displays a 2-fold lower measurement variability than qPCR, owing to its end-point determination, its direct quantification, and the high number of crystal droplets generated per sample.
- Variability in the shown case study can be further decreased to almost 3-fold for Crystal Digital PCR when two wells are grouped using the pooling tool of the Crystal Miner software.
- Crystal Digital PCR provides the high quantification precision required for various applications including copy number variation, low-fold change and rare mutation detection.