How to characterize the Limit of Blank and the Limit of Detection in Crystal Digital PCR™
Introduction
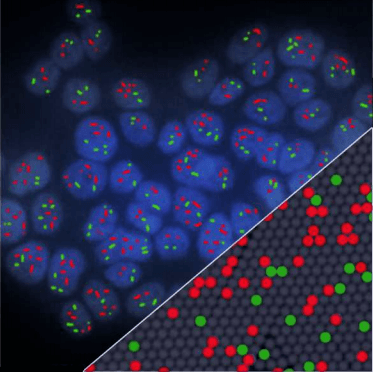
In digital PCR (dPCR) false-positive events can arise from different sources of molecular biology noise. Determining a false-positive cutoff when quantifying nucleic acids is critical to the robustness and reliability of a dPCR assay. Defining the analytical performance indicators of an assay, including the Limit of Blank (LoB) and Limit of Detection (LoD), is fundamental and must be done following precise procedures. The LoB is the upper limit target concentration considered acceptable in a blank sample. The LoB is then used to calculate the LoD, the limit target concentration above which one can affirm the presence of the target and quantify it with a given statistical confidence.
Definitions
Blank sample (can also be referred to as the Negative Control) : In most cases, a blank sample is a sample containing no sequence for any given target. However, the blank sample should be representative of the nature of the samples. For example, if the sample to be tested with the assay is circulating tumor (ctDNA) extracted from plasma or FFPE DNA, the blank sample should be a sample with no mutant sequences but with a background of fragmented wildtype DNA such as ctDNA extracted from a wild-type plasma sample.
Target sequence : DNA or RNA sequence to be amplified and quantified in a dPCR assay.
Limit of Blank (LoB) = When α is the probability of making a false-positive decision on a true blank sample, the LoB is defined as the maximum concentration expected in a blank sample well with a probability PLoB = 1 – α (typically 1 – α = 95% where α = 5% of false positives).
Limit of detection (LoD) = When β is the probability of making a false-negative decision on a sample that truly contains a target, the LoD is defined as the minimum concentration for which detecting the target sequence in a well is possible with a probability of 1 – β (typically 1 – β = 95% where β = 5% of false negatives). In other words, this is the minimum concentration that can be said to be non-zero and statistically higher than the LoB with probability PLoD = 1 – β.
Low-Level sample (LL) = A LL sample is a representative sample in which the target concentration is between one and five times that of the LoB.
No template control (NTC) = A no template control is a reaction containing no nucleic acid.
Experimental Methods
Here, we detail a method to calculate the LoB and LoD of a Crystal Digital PCR™ assay. This method is an adapted version of the Clinical and Laboratory Standards Institute (CLSI) EP17-A2 standard (Protocols for Determination of Limits of Detection and Limits of Quantitation; Approved Guideline). For automated computation, see the easy-to-use LoB/LoD calculation tool available on www.gene-pi.com . Once the LoB and LoD have been defined for an assay, they do not need to be redefined for the assay if the subsequent experiments are performed in the same experimental and environmental conditions.
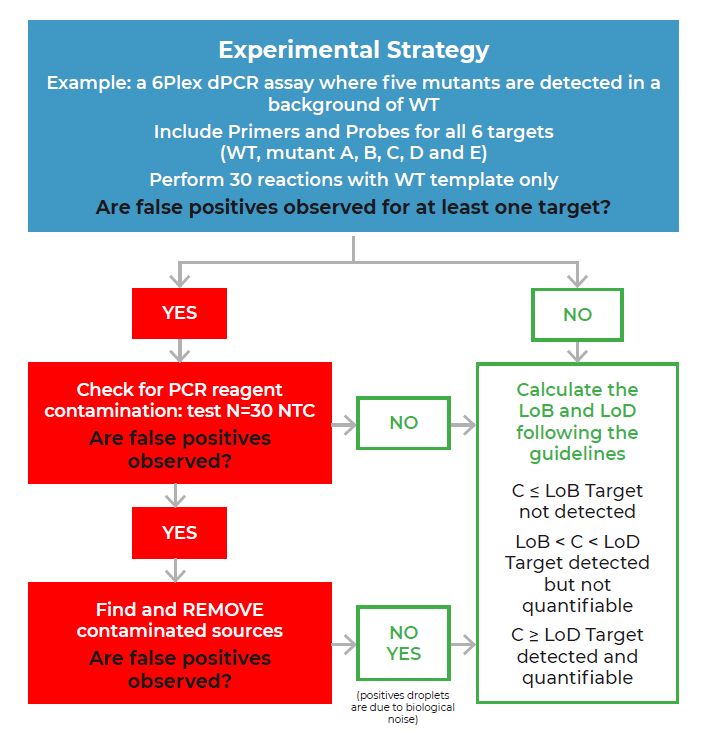
The LoB decision tree
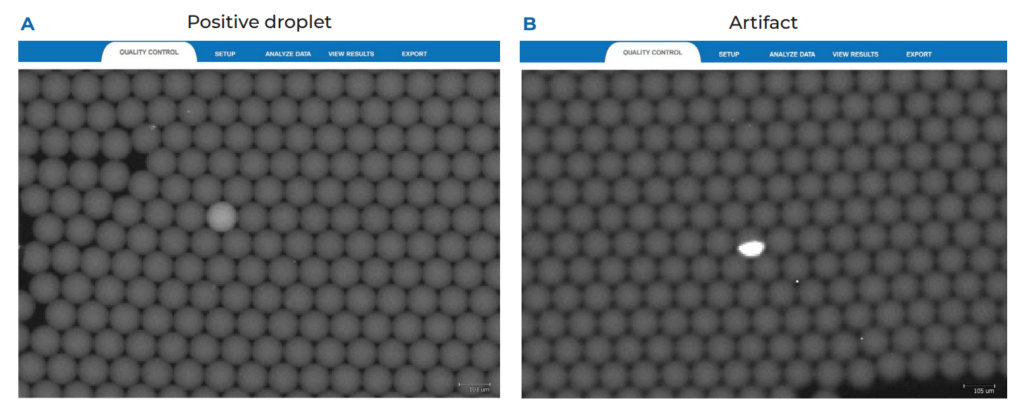
We recommend applying the LoB decision tree as a good practice before validating any new assay, particularly when a target is expected to be at low concentrations (Figure 1). The first step of the LoB decision tree for each target sequence is to perform at least 30 replicate reactions in which the target template is excluded (blank samples). As a good practice, if a small number of false positive droplets is detected for any given target in the blank samples, we recommend verifying each false-positive droplet using the Crystal Miner software to check for the possibility of artifacts. This check can be done by clicking on the Quality Control tab and observing the droplet crystal (Figure 2). Although infrequent, if an artifact has been detected as a positive droplet by the software, exclude the droplet before proceeding to the next step so that it is not considered in the LoB determination (refer to the Crystal Miner software User Manual for steps to exclude droplets). If a high number of false positive droplets is observed, it could suggest possible contamination. In this case, we recommend following the LoB decision tree (Figure 1) to check for the possibility of lab reagent contamination. Once reagent contamination has been ruled out, the remaining false positives should be considered as the biological noise of the assay and included in the LoB determination. Note that the final number of false-positive droplets deemed acceptable depends on the desired sensitivity of any given assay, as the LoB directly influences the LoD of the assay. If too many false positive droplets are observed, the assay should be re-optimized to lower the LoB and increase the sensitivity of the assay.
Please visit Estimate Limit of Blank and Limit of Detection for Digital PCR experiments for the online tool to estimate the LoB and LoD for your experiment.
Below is a detailed description of how to calculate manually the LoB and LoD of an assay. To facilitate the calculation, an automated LoB and LoD calculation tool is available on gene-pi (www.gene-pi.com).
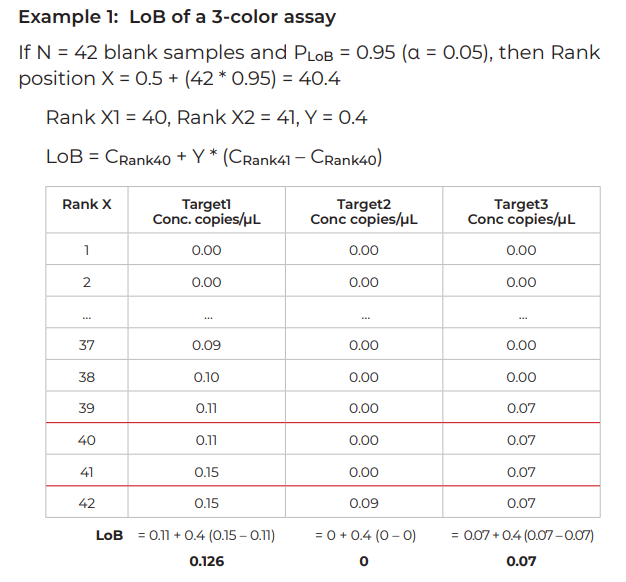
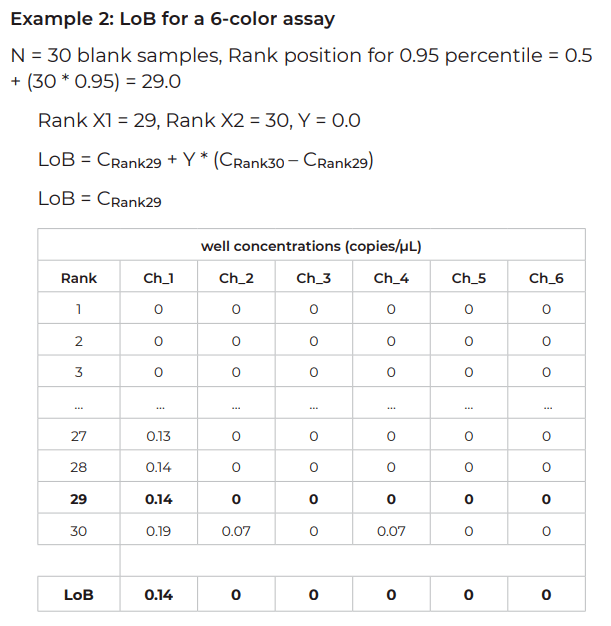
How to calculate the LoB using a non-parametric approach
Once the blank sample material is defined and in hand, perform Crystal Digital PCR™ on the naica® system with N blank samples. It is recommended to analyze at least N = 30 blank samples to reach a confidence level of 95%. For higher confidence levels, more blank samples should be analyzed (for example, for a confidence level of 99%, N = 51 blank samples should be analyzed).
- Using the Crystal Miner software, export the results (well concentrations in copies/µL) and order them in ascending concentration order (Rank 1 to Rank N) for each target independently
- For PLoB, the probability to be a true negative, PLoB is equal to 1 – α. (If α = 0.05, PLoB = 1 – α = 0.95). The rank position X corresponding to this PLoB is equal to: X = 0.5 + (N x PLoB)
- To calculate the LoB, the ranks flanking X and their corresponding concentrations C1 and C2 must be determined.
LoB = C1 + Y *(C2 – C1)
C1 = concentration for rank X1 (X1 = Rank below rank X)
C2 = concentration for rank X2 (X2 = Rank above rank X)
Y = 0.Z; Z corresponds to the digit after the decimal point of X. (For example, if X = 40.4, Y=0.4 or if X = 38.0, Y = 0).
If Y = 0, X1 = X and LoB = C1 (concentration for rank X)
If the LoB is to be tested on several batches of reagents, repeat the LoB calculation protocol as stated above for each reagent batch (N = 30 for each batch). The final LoB of the assay should be assigned the highest value among all the calculated LoB values.
How to calculate the LoD using a parametric approach
The Low-Level (LL) samples used to calculate the LoD should be representative positive samples or a representative sample matrix with spiked-in target concentrations within a range of one to five times higher than the calculated LoB. Either the same concentration or different concentrations can be used for each LL sample, as what is being measured is the variability across replicate measurements of these samples and not the final absolute concentration.
Note that this parametric approach for calculating the LoD can only be used if the sample concentrations are normally distributed.
To determine the LoD:
- Perform Crystal Digital PCR™ on the naica® system on a minimum of five independently prepared LL samples (LL1, LL2, LL3, LL4 and LL5), performing at least six replicates per LL sample.
- Determine the standard deviation SDi for each group of replicates (SD1, SD2, SD3, SD4 and SD5). The quantification variability between LL samples should not be significantly different. The significance of this difference should be checked with a statistical method (Cochran’s test, for example). A significant difference in quantification variability between LL samples suggests either an instability of the reaction or a concentration range too large for the selected LL samples (in which case, repeat the study with more appropriate samples).
- Calculate the global SD (SDL)
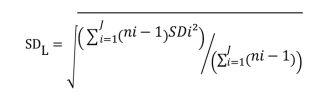
SDi = SD of all results for the ith low level sample
ni = the number of results for the ith low level sample
J = number of LL samples
Note that if all the LL samples contain the same number of replicates, SDL can be calculated with the following formula: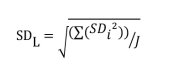
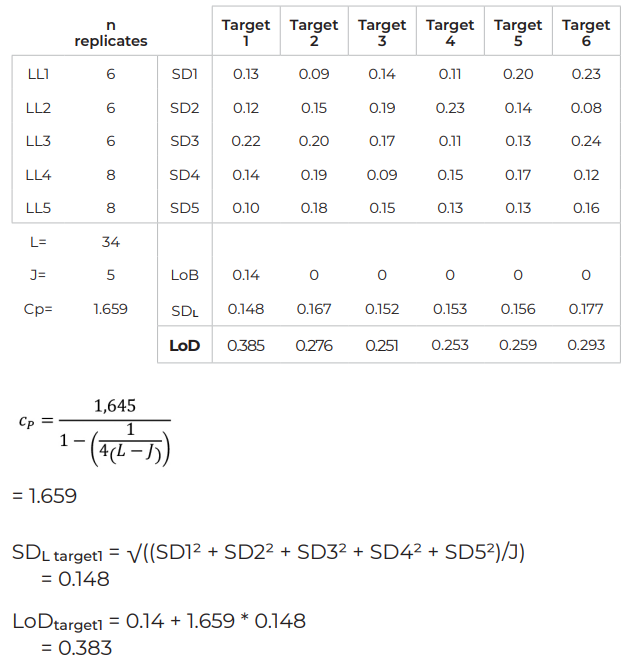
- Calculate Cp = coefficient to give the 95th percentile of a normal distribution
L = total of samples (J x n replicates, n ≥4)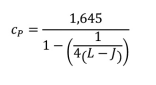
The value 1.645 represents the 95th percentile from the normal distribution for β = 0.05. If a different β value is chosen, this multiplier will need to change accordingly.
LoD = LoB + Cp * SDL
If the LoD is to be tested on several batches of reagents, repeat the LoD calculation protocol as stated above for each reagent batch (performing six replicates of five LL samples for each batch). The final LoD of the assay should be assigned the highest value among all the calculated LoD values.
Example – LoD for a 6-color assay
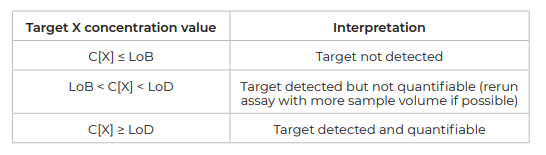
How to determine if a target is quantifiable or detectable
Once the LoB and LoD are calculated for each target of a given assay, use the following decision table to determine if the target concentration obtained for a given real-life sample can be considered as detectable or quantifiable:
References
The method to determine the LoB and LoD described here is based on an adapted version of the Clinical and Laboratory Standards Institute (CLSI) EP17-A2 standard: Protocols for Determination of Limits of Detection and Limits of Quantitation; Approved Guideline https://clsi.org/standards/products/method-evaluation/documents/ep17/
Technical Note Highlights
- To validate the sensitivity of an assay, the LoB decision tree should be followed to characterize the LoB for each target, particularly when a target is expected to be in low concentrations.
- The LoB sets the false-positive cut-off and thus the upper limit target concentration considered acceptable in a blank sample for detecting nucleic acids with digital PCR.
- The experimentally defined LoB for a target is necessary to calculate the LoD of the target and to determine if a reaction is positive for the target.
- A target is considered as “detected” if the measured concentration is strictly higher than the target-specific LoB.
- A target is considered as both “detected and quantifiable” if the measured concentration is strictly equal to or higher than the target specific LoD.