Evaluation of the Intra-run repeatability of Crystal Digital PCR™
Variability sources of the Crystal Digital PCR workflow
Crystal digital PCR (cdPCR) enables fast and reliable absolute target quantification. The Naica™ System permits the simultaneous processing of three Sapphire chips, each with four sample wells, for a total of 12 samples. The straightforward workflow, requires a single pipetting step, thereby considerably limiting the variability contributed by the operator. Overall, there are two main sources of dPCR measurement variability:
- Theoretical Poisson uncertainty, an inevitable component that accounts for both sampling error and partitioning error.
- Experimental dPCR measurement variability, inherent to each dPCR workflow (e.g. pipetting step).
Workflow setup to assess intra-run repeatability
Here, we assessed the intra-run repeatability with a 3-color assay having the same expected final target concentration in each color: BRAF-FAM in Blue channel, EGFR-HEX in Green channel, ALB-Cy5 in Red channel (Figure 1). To allow robust statistical analysis, three runs of three Sapphire chips were performed for each concentration, for a total of 36 wells (four wells per Sapphire chip).
To minimize potential sources of variability external to the theoretical Poisson error and the naica® System (Geode, Prism3), all experiments were performed in controlled conditions: for each of the three concentrations the Sapphire chips were thermocycled in the same Geode and read by the same Prism3, on the same day, by the same operator, using the same pipets to depose a single PCR master mix.
Coefficient of variation calculation and statistical analysis
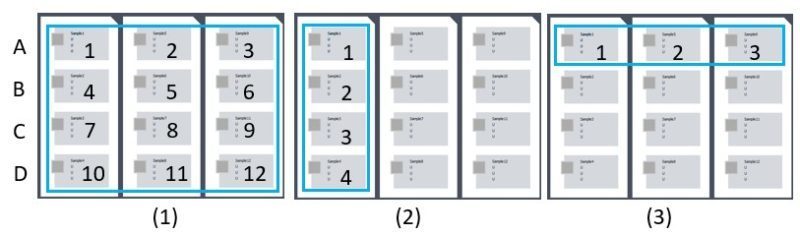
Three different position comparisons were performed to evaluate intra-run variability:
1) Inter-well, intra-run variability
For each run of three Sapphire chips (12 wells, Figure 2), the measured total variability was evaluated by exporting the target concentration values measured by the naica® System and calculating their coefficient of variation (CV) adjusted using Bessel’s correction:
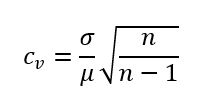
Where:
- μ is the arithmetic mean of the concentration value
- σ is the standard deviation of the concentration values
- n is the number of replicate points (12 points for 12 wells)
The experimental variability at 95% confidence level can be deduced by subtracting the theoretical Poisson error from the measured total variability:

2) Inter-well, intra-chip, intra-run variability
The calculation is the same as indicated above, except that it is applied to each chip (4 points for 4 wells of a chip, Figure 2) of the same run.
3) Intra-well position, inter-chip, intra-run variability
The calculation above is applied to each of the 4 well positions in the chip (A, B, C, D) among the three chips of the same run (3 points for 3 chips per run, Figure 2).
In order to check whether there is a statistically significant difference between the three conditions, a two-tailed Mann-Whitney statistical test with 5% significance level was performed, first on the means of the concentrations measured in all channels, and then on the Bessel corrected CVs in all channels, using the following calculator: https://www.socscistatistics.com/tests/mannwhitney/default2.aspx
For each of the 3 tested concentrations (200 cp/μL,2000 cp/μL, 10000 cp/μL), no significant difference (p<0.05) was found between the concentration mean values of condition (1) versus (2), (2) versus (3) and (3) versus (1). Likewise, no significant difference (p<0.05) was found between the corrected CV values of condition (1) versus (2), (2) versus (3) and (3) versus (1).
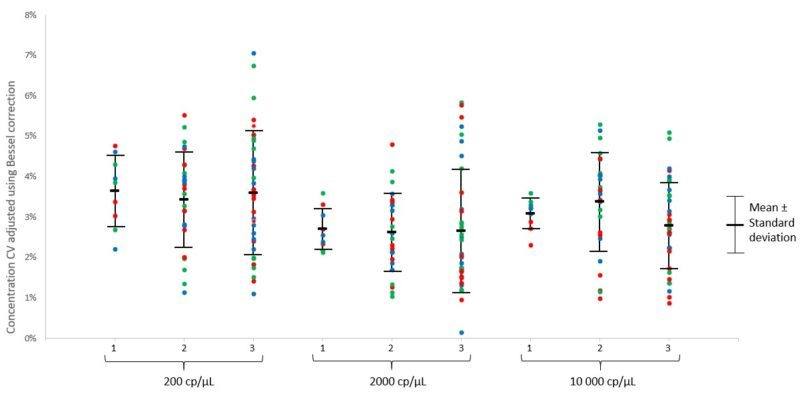
Taken together, the data for both the concentration mean and CV indicate that no statistical difference (p<0.05) was found between the three conditions, for each of the three tested concentrations under the described experimental conditions (Figure 3).
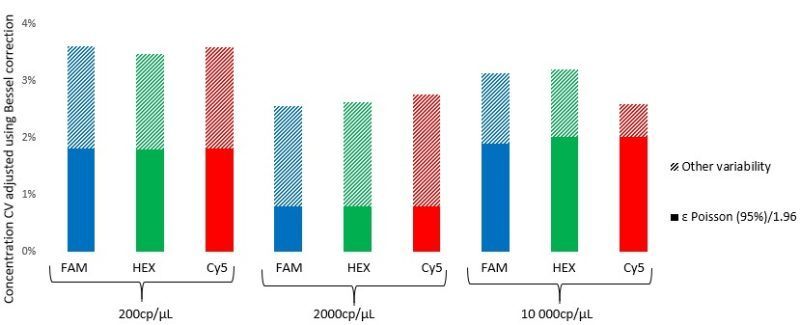
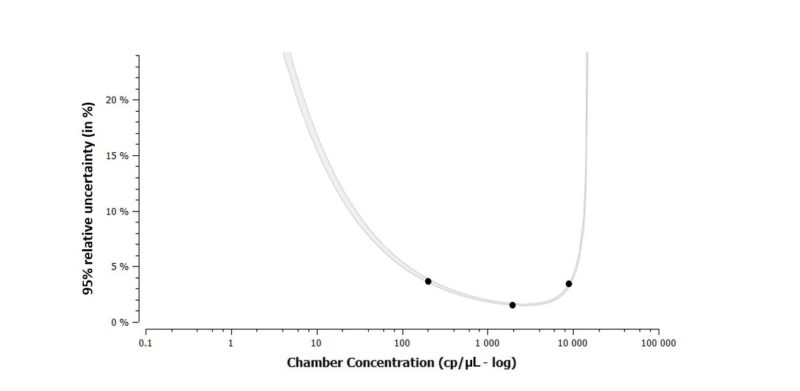
The graphical representation of the total measurement variability shows that both the measured total variability and the theoretical Poisson error depend on the target concentration (Figure 4). In the described experiment conditions, total variability remains low (<4%), with experimental sources of variability representing on average, half of the total variability. As such, a single control well is largely sufficient for a full three-chip run, and users can freely randomize the position of this single control.
Technical Note Highlights
- Repeatability is a key Performance Criteria to assess the quality of a dPCR test.
- The simple and integrated workflow of the naica® System minimizes experimental error.
- The total intra-run variability of the naica® System with Sapphire chips in the tested conditions is less than 4% at final concentrations from 200 to 10000 cp/μL.
- A single control well at any position in the Geode is sufficient to control the entire run.